
Custom Design
Imagine this: You’re in a quarterly review session, and everyone’s tossing around ideas of what’s going well and what isn’t. Does this ring a bell?
Whereas gut instincts play their role, successful companies recognize that data collection and analysis are the foundation of every wise choice. Whether you’re a startup entrepreneur looking to know your earliest consumers or an expanding business seeking to scale effectively, being able to dominate how you’re gathering information and making sense of it can be the difference between guessing and knowing.
We’ve watched far too many companies waste expensive mistakes due to assumption over evidence. The best news? Developing a solid data collection and analysis system doesn’t take a PhD in statistics or a huge bankroll.
This site will guide you through all you have to know regarding converting raw data into actionable business intelligence that actually produces outcomes.

Data Collection and Analysis is the process of gathering, cleaning, analyzing, and interpreting data in order to make sound business decisions. It’s your business detective work – gathering evidence (data) and connecting the dots to solve problems and find opportunities.
At its core, data collection means systematically accumulating information from a host of sources – your customers, web visitors, sales teams, social media outlets, or market surveys. Analysis takes this raw data and puts it into context so you can actually use it.
Here’s why this is so strong for your business: rather than speculating why sales fell last month, you’ll know just which products, channels, or customer segments were behind the shift. Rather than making an educated guess about which marketing programs perform best, you’ll have specific proof of what yields the greatest return on investment.
True magic occurs when you transcend simply gathering numbers to interpreting what they imply for your brand’s development and customer relationships.
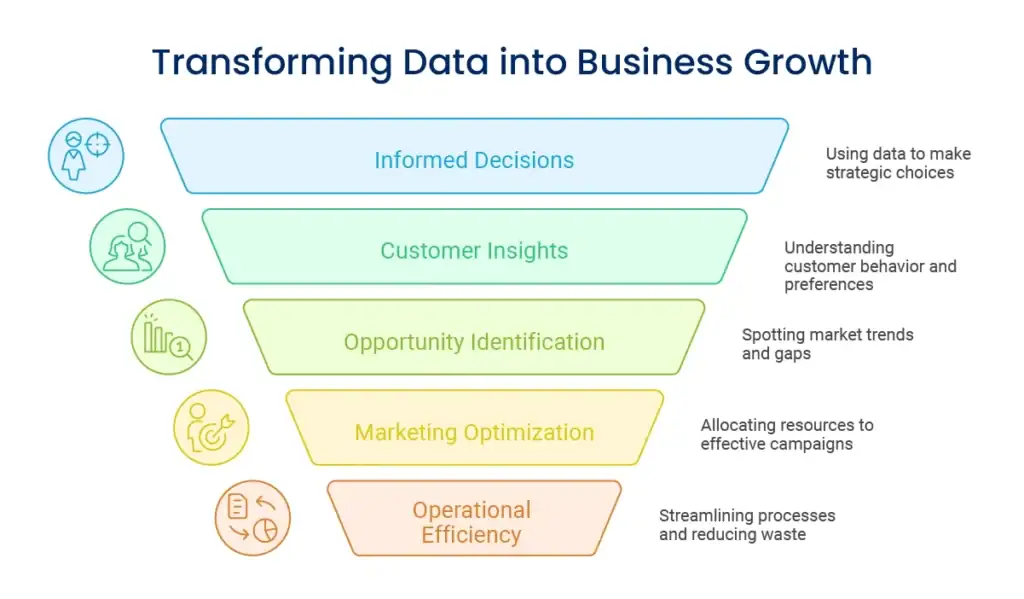
Sophisticated data collection and analysis techniques aren’t nice-to-haves – they’re must-haves for any company that desires to succeed, not just survive. Here’s why it’s more critical than ever:
End the second-guessing. With good data behind your decisions, you can proceed with confidence in knowing you're making smart decisions, not costly guesses.
Demographics at the surface level inform you who they are. Quality analysis shows you how they act, what they value, and what makes them buy from you over others.
Properly executed data systems serve as early alert systems, pointing out nascent trends, shifts in customer attitudes, and market gaps you can exploit.
Know precisely which channels, campaigns, and messages produce the most effective results. Shift budget from low-performing activities to those that truly drive growth.
Discover bottlenecks, eliminate waste, and simplify processes. Analytics inform you where time and resources are wasted and where making small changes can have a dramatic impact.
Knowing the behaviour patterns of customers allows you to deliver better service, develop more relevant products, and talk in a manner that really speaks to them.
When you get good at data collection and analysis, you’re really creating a competitive moat for your company – one that’s extremely hard to breach for the competition.

Before considering collection methods and analysis approaches, you must consider strategically data as a business asset. Just as you would not buy costly equipment without knowing what it will do, you should not collect data without definite strategic goals.
Your data strategy must be closely tied to your business objectives. Are you attempting to grow customer lifetime value? Enhance conversion rates? Open new markets? Every goal demands unique information and analysis techniques.
Begin by determining your essential business questions. What are you deciding in the next 6-12 months? What data would make those choices easier and more precise? This will make sure you’re gathering meaningful data instead of being overwhelmed with useless metrics.
Consider your data infrastructure similar to a building’s foundation. Get this incorrect, and everything else will be unstable. Your information architecture encompasses how you gather, store, organize, and access data throughout your organization.
Consider both the present needs and future expansion. The setup that is suitable for a 10-person startup may not serve when you reach 50 employees. Plan for integration among disparate tools and platforms upfront.
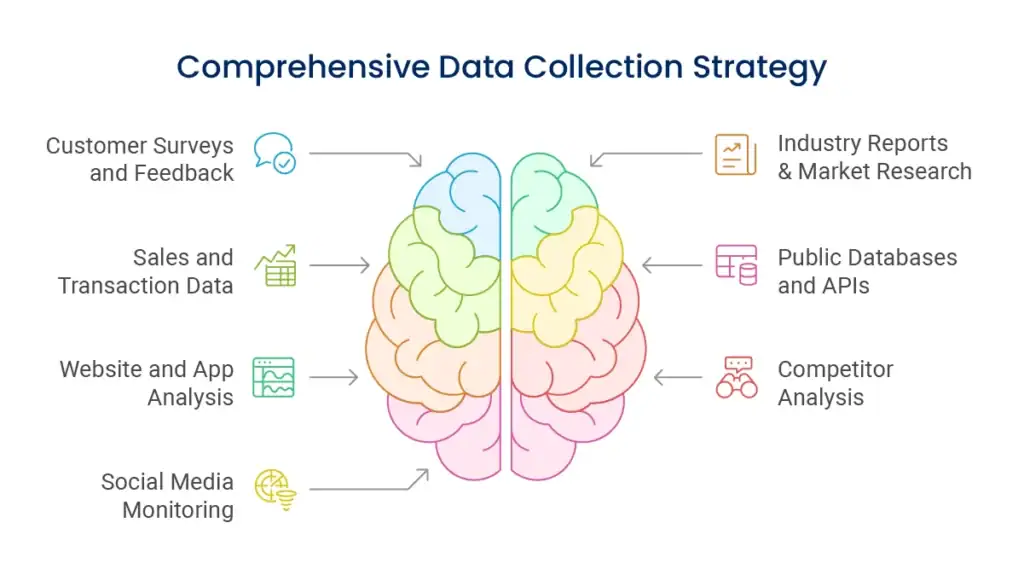
Good data collection techniques marry systematic with good business sense. You need complete information without overloading your staff or customers.
Direct customer feedback gives you insight unavailable from any other source. Create surveys that pose specific, actionable questions instead of generic satisfaction scores. Time surveys strategically – shortly after purchase, after customer service interactions, or in-use.
Your online assets produce enormous volumes of behavioral data. Monitor not only the number of visitors but also user paths, conversion funnels, and interaction patterns. Watch where people fall off, what content holds their attention, and how various traffic sources act differently.
Each sale is a tale of customer tastes, seasonal trends, and product success. Analyze purchase history to determine trends, forecast demand, and know customer segments. Drill deeper than aggregate sales figures to know profitability by product, customer, and channel.
Social media provides real-time customer sentiment, competitor activity, and market trend insights. Track mentions of your brand, keywords in your industry, and competitor activity. Look at context and sentiment, not volume alone.
Make use of existing studies to gain understanding of wider market context. Industry associations, government data, and research firms offer useful benchmarking data and trend analysis.
Keep track of competitor prices, product releases, marketing initiatives, and customer reviews systematically. SEMrush or social listening tools can gather much of this data automatically.
Numerous useful sources of data are available for free from government databases, industry associations, and platform APIs. Weather patterns, economic conditions, and demographics can all be used to gain useful context for your business metrics.

Bad quality data results in bad decisions. Data preparation and cleaning isn’t exciting work, but it is absolutely essential to sound insights.
Missing data leaves blind spots in your analysis. Define minimum data requirements for various collection points and have validation rules to trap incomplete submissions.
When various systems or individuals enter data differently, analysis is almost impossible. Standardize formats for dates, names, addresses, and categorical data across all collection points.
Multiple entries for the same customer, transaction, or event bias results and consume resources. Implement deduplication processes and unique identifier systems.
Stale data can result in conclusions that are no longer current. Set up periodic data refresh schedules and determine which data requires real-time updates versus refreshes on a periodic basis.
Make checks at data entry points to detect errors as they occur. This consists of format validation, range checking, and cross-field validation rules.
Establish mechanisms that automatically alert potential quality issues. Look for abnormal patterns, missing data, or values outside the anticipated range.
Run routine reviews of data quality across all sources. This includes ad-hoc checking of accuracy, verifying collection processes, and ensuring data governance policies are enforced.
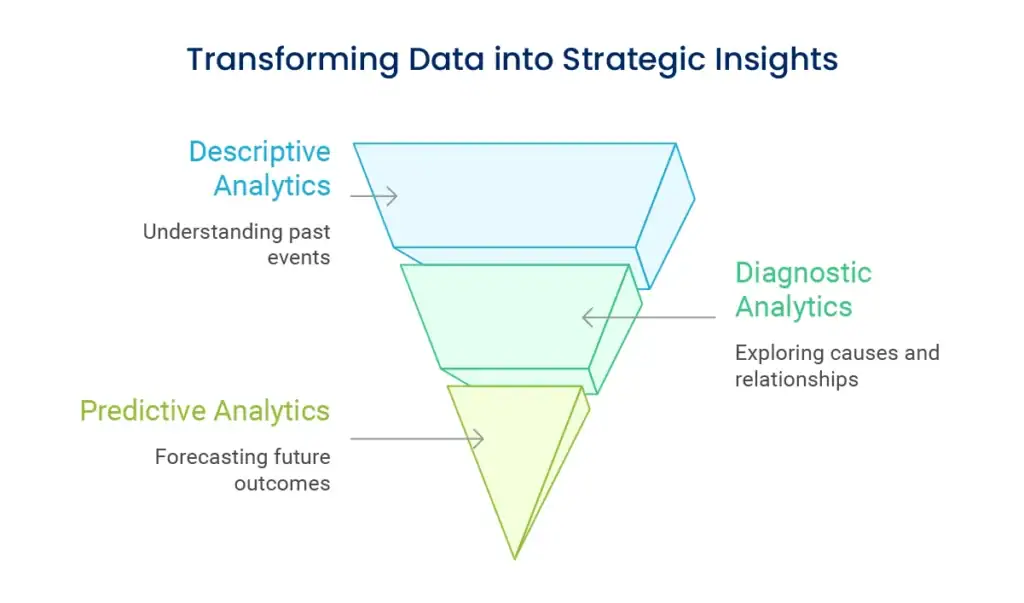
Having clean data is only the beginning. Data analysis methods turn information into usable business intelligence.
Recognize patterns over time in order to know business performance and seasonality. Analyze year-over-year, monthly trends, and longer term trends. This is the basis for more sophisticated analysis.
Divide customers, products, or channels into groups based on common characteristics or behaviors. This uncovers significant differences between groups that can be used to guide targeted initiatives.
Compare your measures to industry norms, competition, or your internal history. This provides context to recognize whether your numbers are good, troubling, or outstanding.
Determine how different variables relate to one another to grasp potential cause-and-effect connections. Keep in mind that correlation does not equal causation, but it can point out areas to investigate further.
Monitor certain groups of customers over time to grasp how behavior shifts and what drives retention, spending, or engagement.
When there is a significant change in performance, systematic examination can define the underlying causes. This could include reviewing various data sources and hypothesis testing.
Determine how different variables relate to one another to grasp potential cause-and-effect connections. Keep in mind that correlation does not equal causation, but it can point out areas to investigate further.
Assume the total value each customer will generate for your business. This drives spending on acquisitions, retention efforts, and resource allocation decisions.
Determines customers, products, or market segments that pose more risk for your business. This allows for proactive planning instead of reactive measures.
The proper tools make data collection and analysis easier and more accessible to everyone on your team. Select solutions that are aligned with your existing capabilities but with scope for growth.
Google Analytics 4 Powerful and free for website analysis. Offers deep insights into user behavior, conversion tracking, and audience segmentation. Worth the learning curve for the level of insights offered.
Powerful and free for website analysis. Offers deep insights into user behavior, conversion tracking, and audience segmentation. Worth the learning curve for the level of insights offered.
Systems Consolidate customer information and monitor interactions at all touchpoints. Contemporary CRM platforms such as HubSpot, Salesforce, or Pipedrive include inbuilt analytics and reporting functions.
Tableau, Power BI, or Google Data Studio type of platforms enable the visualisation of intricate information and the development of interactive dashboards. Such tools do well in merging data from various sources into logical reports.
Tools such as Typeform, SurveyMonkey, or Google Forms automate feedback gathering. Seek tools that allow seamless integration with your current systems to prevent data silos.
Tools such as Hootsuite Insights, Brandwatch, or even free Google Alerts enable monitoring of brand mentions and industry discussions without searching manually.
Tools such as Mailchimp, Constant Contact, or ConvertKit offer comprehensive insights into email performance, subscriber behavior, and campaign effectiveness.
Start by analyzing a single or two important metrics and scale your analysis gradually. This avoids overwhelming your team and helps you actually implement the insights that you create.
Connected tools have more valuable insights than stand-alone data sources. Search for platforms sharing information easily or utilize integration tools such as Zapier in order to link different systems.
Make sure that team members know how to decipher and respond to the data you are gathering. Ongoing training and clear documentation increase the worth of your investment.

Raw numbers never tell the whole story. Data interpretation and visualization converts convoluted information into simple, actionable facts your team can grasp and apply.
Bar charts for comparisons, line charts for over-time trends, pie charts for percentages, and scatter plots for correlation. Tie the visualization to the insight you are trying to convey.
Every chart or dashboard must have a specific reason. Don’t overwhelm visualizations with excessive information. If it takes more than 30 seconds for audience members to get your message, simplify.
Standardize color, fonts, and layouts in all your reports. This produces professional materials and engages audience members to concentrate on insights instead of design aspects.
Every chart or dashboard must have a specific reason. Don’t overwhelm visualizations with excessive information. If it takes more than 30 seconds for audience members to get your message, simplify.
Let users drill down from summary measures to detailed examination. This benefits both executives who desire high-level summaries and analysts who require detailed information.
Update Regularly Outdated dashboards become abandoned dashboards. Define definite refresh cadences and keep data fresh and relevant.
Begin reports with main findings and recommendations, not methodology or data. Busy decision-makers must see implications right away.
Each discovery should have concrete suggestions for action next. Generalities such as “boost customer satisfaction” don’t help. Concrete actions such as “lower email response time to less than 2 hours” get things done.
Give someone the responsibility of implementing each action suggestion. Add deadlines and measure of success to make sure follow-through occurs.
Track whether your data-driven changes really deliver anticipated results. This confirms your analysis techniques and indicates the areas where improvement can be made.
Utilize the implementation results to enhance your techniques of data collection and analysis methodologies. What data would have made recommendations more precise?
When analysis-driven decisions yield successful outcomes, communicate these successes to your team. This instills confidence in your analysis process and provokes wider adoption.
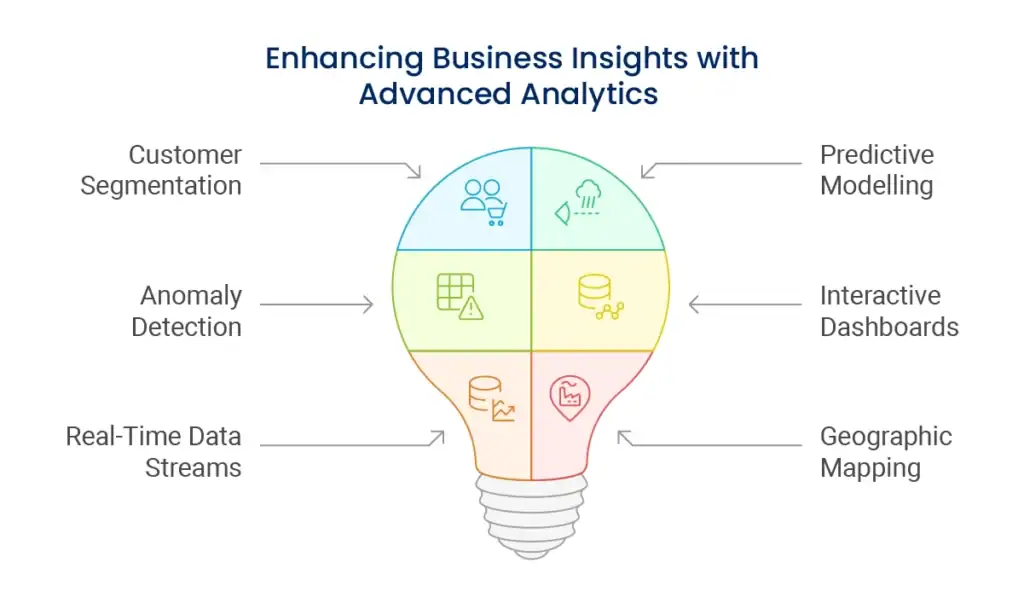
With more mature data abilities, sophisticated methods will make possible deeper insights and competitive value.
High-quality algorithms can distinguish between customer segments based on intricate behaviour patterns that would be impossible to notice by hand. These segments may deliver unexpected insights on customer preferences and requirements.
Machine learning may spot faint patterns in past data to forecast future events with higher accuracy than legacy forecasting techniques.
Automated systems can alert on strange patterns which may signal issues, opportunities, or data quality problems. This is especially useful for large datasets where it’s not feasible to monitor manually.
Enable users to filter, drill down, and investigate data for themselves. This brings analysis power to everyone in your organisation.
For businesses with rapidly changing environments, real-time visualizations can spot immediate opportunities or issues which need rapid responses.
Geographic analysis is able to uncover regional trends, best distribution methods, or expansion possibilities that would otherwise remain hidden in the usual reports.
Geographic analysis is able to uncover regional trends, best distribution methods, or expansion possibilities that would otherwise remain hidden in the usual reports.
High-quality algorithms can distinguish between customer segments based on intricate behaviour patterns that would be impossible to notice by hand. These segments may deliver unexpected insights on customer preferences and requirements.
Machine learning may spot faint patterns in past data to forecast future events with higher accuracy than legacy forecasting techniques.
Automated systems can alert on strange patterns which may signal issues, opportunities, or data quality problems. This is especially useful for large datasets where it’s not feasible to monitor manually.
Enable users to filter, drill down, and investigate data for themselves. This brings analysis power to everyone in your organisation.
For businesses with rapidly changing environments, real-time visualizations can spot immediate opportunities or issues which need rapid responses.
Geographic analysis is able to uncover regional trends, best distribution methods, or expansion possibilities that would otherwise remain hidden in the usual reports.
Responsible data collection and analysis foster customer trust with legal compliance. Robust governance models safeguard both your company and your customers.

Clearly state what you are collecting, how you plan to use it, and what customers gain as a result. This creates trust and tends to enhance rates of collection.
Clearly state what you are collecting, how you plan to use it, and what customers gain as a result. This creates trust and tends to enhance rates of collection.
Data privacy laws change continuously. Regular review ensures your practices remain compliant and in line with best practices.
Data privacy laws change continuously. Regular review ensures your practices remain compliant and in line with best practices.
Reflect on how your analysis and ensuing decisions impact various customer segments, employees, and communities. Ethical businesses think in terms of stakeholders beyond direct profitability.
Keep your analysis techniques solid and your conclusions backed by facts. Deceptive analysis can trigger destructive decisions even with good intentions.
Your efforts at data collection and analysis should themselves be quantified and optimised. Monitor immediate results as well as longer-term value creation.

Monitor how fast your team is able to make knowledge-based decisions and monitor the results of data-driven decisions versus decisions based on intuition.
Measure the financial benefit of the insights created through your analysis. This could be the avoidance of waste, increased conversion rate optimizations, or new revenue streams discovered.
Measure the gains in operational efficiencies, the elimination of manual work, and enhanced customer experiences arising from improved understanding of data.
Calculate the unambiguous monetary gains realized through data-driven decisions. This includes reduced costs, increased sales, and risk avoidance.
Measure the amount of time your team is able to save by relying on solid facts rather than wasting hours arguing opinions or doing last-minute research.
While harder to quantify, consider the value of insights that help you respond to market changes faster than competitors or identify opportunities others miss.
Effective data initiatives take more than techniques and tools – they take cultural transformation that accepts evidence-based decision making across your organisation.
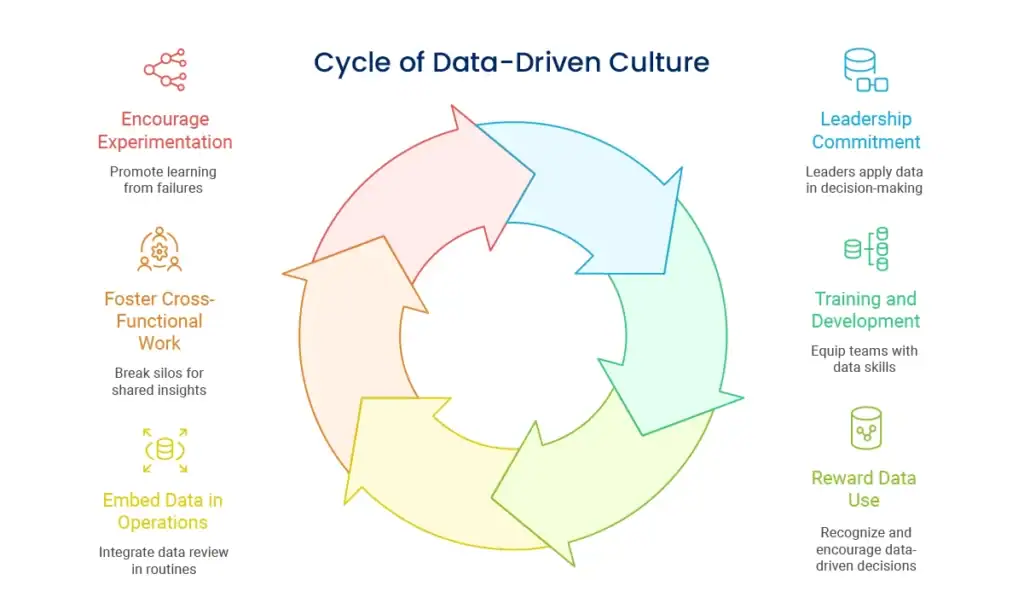
Leadership groups should have to regularly apply data to their own decision-making and request evidence when considering recommendations from others.
Make sure team members possess the capability to gather, interpret, and take action on data. This involves technical training as well as development of analytical mind.
Reward and encourage team members who utilize data properly, even if their findings conflict with common sense or necessitate tough adjustments.
Make data review a routine component of team meetings, project planning, and performance monitoring procedures.
Smash departmental silos so insights are communicated and followed up by the whole organisation.
Foster experimentation, failure learning, and ongoing refinement of data collection and analysis procedures.
The landscape of data is changing quickly. Savvy companies embed flexibility in their systems and keep up with new trends and technologies.
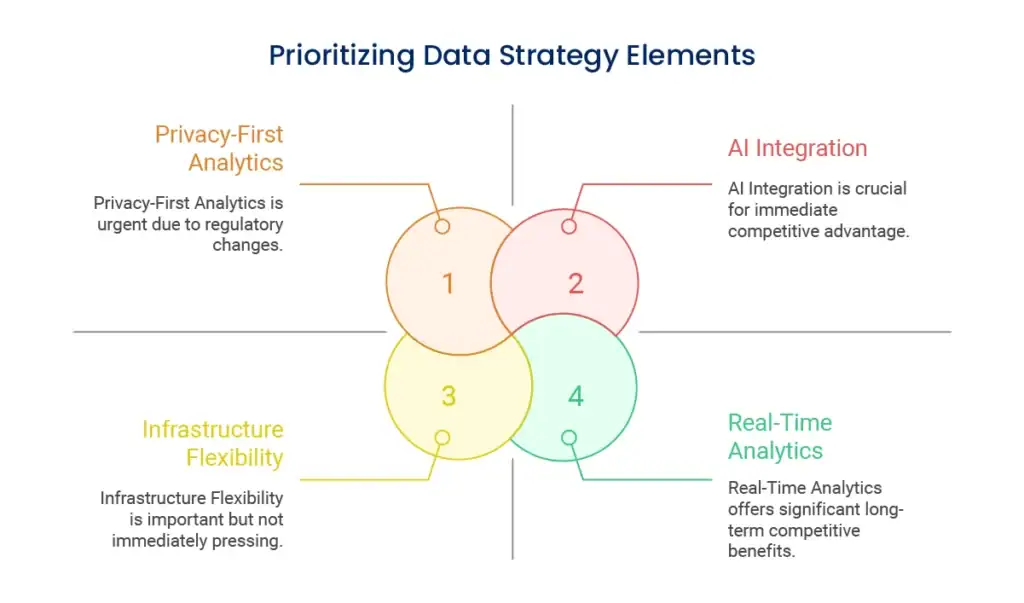
AI software is becoming increasingly powerful and affordable for small and medium enterprises. Keep up-to-date with applications that may augment your analytical capabilities without necessitating huge investments.
AI software is becoming increasingly powerful and affordable for small and medium enterprises. Keep up-to-date with applications that may augment your analytical capabilities without necessitating huge investments.
Growing privacy legislation and user awareness necessitate novel strategies for data collection and analysis that honor user privacy yet deliver beneficial insights.
Select processes and systems that will expand with your business without necessitating full overhauls. Cloud options tend to be more scalable than on-site systems.
Develop plans for how the analytical abilities of your staff will develop as your business expands. This may involve further training, recruiting new staff, or collaborations with special firms.
Keep your technology stack up to date and plan periodic upgrades, integrations, or replacements. Monitor new tools that might enhance your capabilities or save you money.
Knowing market trends and consumer behavior enables companies to create more efficient content marketing strategies that appeal to target groups. When you merge sound data collection and analysis with creative content creation, you produce marketing campaigns that are both interesting and quantifiably successful.
Likewise, companies that excel in data collection and analysis frequently discover they can enhance their brand positioning strategy by learning precisely how consumers view their brand in relation to others. This informed positioning enables more effective market differentiation.
For companies wishing to maximize their online presence, data analysis uncovers which elements of digital marketing offer the greatest return on investment, enabling them to better allocate budget and optimize campaigns.
Developing data collection and analysis skills is not about becoming an expert in statistics – it’s about creating systematic methods of knowing your business, customers, and opportunities in the marketplace. By integrating strong data with solid thinking and focused action, you form lasting competitive advantages that are hard for competitors to match.
The companies that will succeed in the next decade will be those that have the ability to rapidly transform information into insights and insights into action. Begin with the building blocks we’ve established here, prioritize fixing real business issues, and build more advanced capabilities incrementally as you develop your confidence and skills.
Keep in mind, by the way, that there is no such thing as perfect data, and you never need it to make improved choices. You want to be more right more often, but you don’t want to remove uncertainty altogether. With regular effort and the proper method, your data collection and analysis skills will be among your greatest business resources.
It requires time, skills, and the proper technology foundation to build strong data capabilities. If you’re willing to change the way your company handles information but don’t know where to begin or how to expand what you’re doing, we’d be happy to help you build a data strategy that works for your unique requirements and objectives.
Enter your email to get instant access