
Custom Design
Insights and Analytics: Transforming Data into Strategic Business Decisions
Are you drowning in business data but not making headway pulling out valuable insights? Most business owners accumulate enormous information but end up finding it hard to turn numbers into action that fuels growth. Without analytics, your precious data is just that—data, not the strategic asset that it can be.
At its essence, insights and analytics is finding the narrative within your numbers and leveraging it to make better business decisions. Through this resource, you will learn how to transform raw data into actionable business intelligence that puts your brand ahead of the game.
Table of Content
What is Insights and Analytics?
Insights and analytics is a defined process of gathering, analyzing, and interpreting data to identify patterns and derive insightful information that informs business decisions. While basic data reporting will inform you about what occurred, real analytics tells you why it occurred and what will happen in the future.
This field is a crossover between data science, business strategy, and communications. It isn’t merely about number-crunching but getting complicated information into understandable, actionable business advice. With it done correctly, insights and analytics is your business compass, guiding the way to opportunities and steering you around obstacles before they are problems.
For startups and small companies, analytics does not have to be complicated or costly. Even simple analysis of your customer data, website usage, or sales trends can uncover opportunities for growth and savings that would otherwise go unnoticed.

Why It Matters for Your Brand or Business
Successful insights and analytics drive real value that immediately affects your bottom line and brand power. Here’s why it’s important:
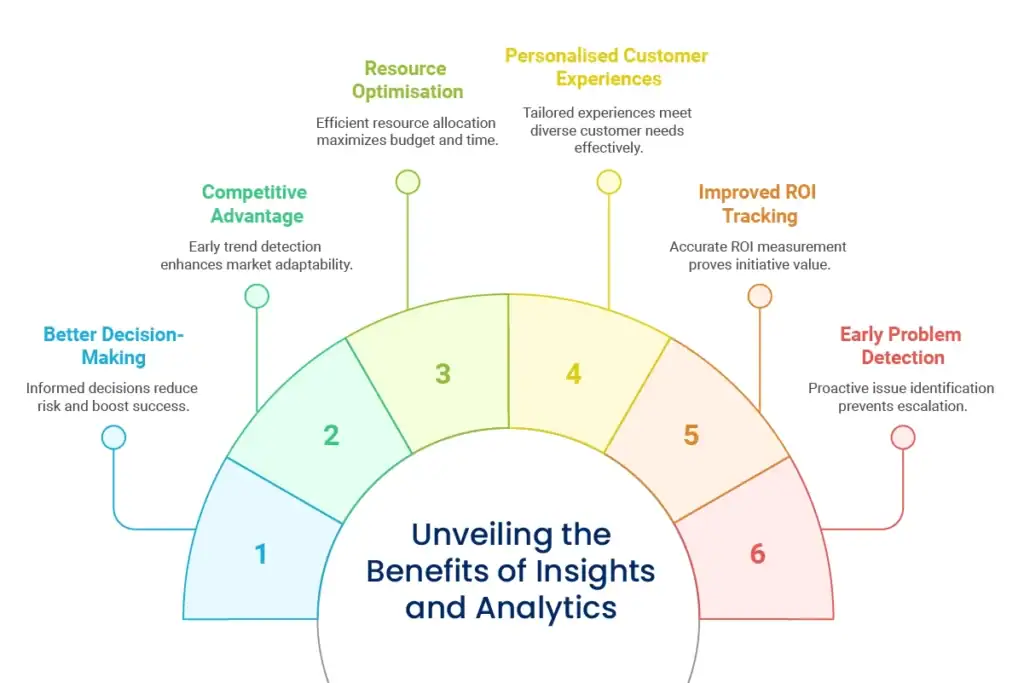
Better decision-making
Substitute gut feeling with fact-based decisions, minimizing risk and maximizing success rates.
Competitive edge
Identify market trends and customer requirements ahead of your competitors, enabling you to react quicker.
Resource optimisation
See what's working and what's not, so that you can better budget your limited funds and staff time.
Personalized customer experiences
Recognize various customer groups and their requirements to design more pertinent offerings and communications.
Improved ROI tracking
Track the real effect of your marketing and brand efforts, demonstrating their value to stakeholders.
Early problem detection
Spot problems in your company operations or customer experience early before they become major issues.
Key Components of an Effective Insights and Analytics Framework
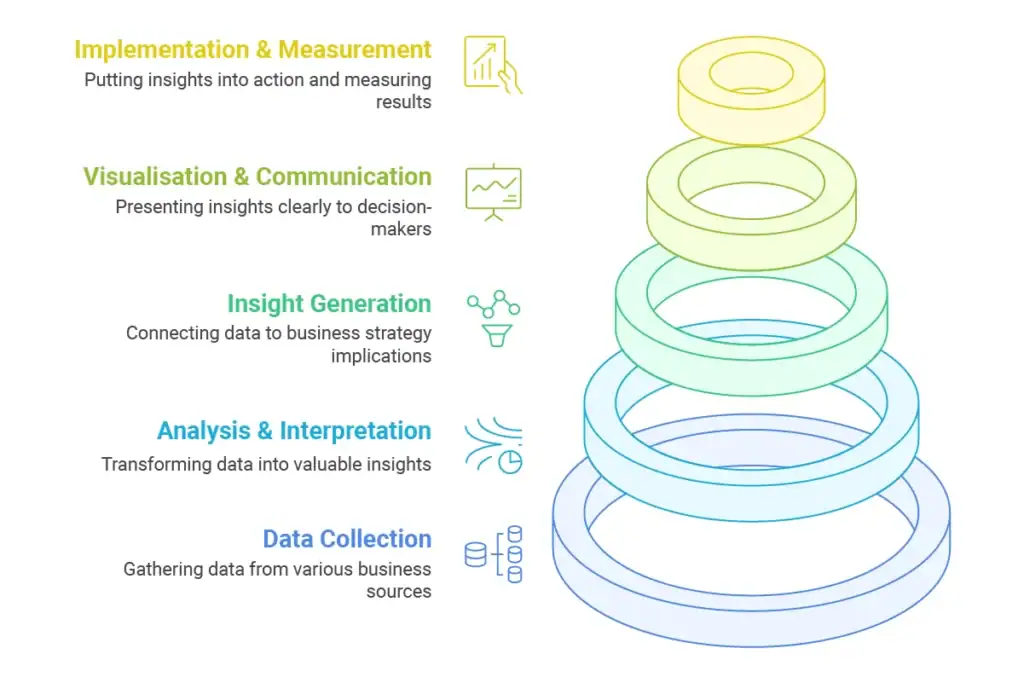
In order to maximize your data, you require a comprehensive analytics platform. Below are the five components that matter most:
- Data Collection and Integration
- Analysis and Interpretation
- Insight Generation
- Visualisation and Communication
- Implementation and Measurement
Data Collection and Integration
This initial step entails collecting pertinent data from various sources in your company—web site interactions, sales transactions, customer service history, social media activity, and market studies.
The problem for most small businesses is shattering data silos. When data is locked away in isolated systems, you are missing out on connections that may uncover valuable insights. Easy integration solutions can facilitate the merging of data from your website, CRM, email marketing service, and social media channels to provide a fuller picture.
Success here is not collecting everything, but collecting the right data points that are in line with your business questions and objectives. Quality over quantity for meaningful analysis.
Analysis and Interpretation
This is where unprocessed data turns into useful insights based on statistical treatment, pattern identification, and domain knowledge. For small companies, this does not always mean sophisticated data science capabilities—there are a number of user-friendly tools available to spot trends and correlations.
The approach is to first ask the right business questions and subsequently seek answers within the data. That could be looking at which products various customer groups like best, which channels provide the best quality leads, or which factors most drive your customers’ purchase decisions.
Good analysis integrates both quantitative (number-based) and qualitative (perception-based) data for a better understanding of what’s occurring in your business and why.
Insight Generation
This next step goes beyond what the information indicates to what it implies for your company. It’s about making connections between data points to get to the “why” of trends and the “so what” implications for your strategy.
For instance, learning that website visitors from a specific traffic source have 50% increased conversion rates is interesting information. The insight is when you realize why it is the case and how you can use this information to optimize other channels or double up on what’s performing well.
The most effective insights are concrete, specific to your business objectives, and immediately actionable for decision-making. They tend to break assumptions and give new angles on old issues.
Visualisation and Communication
Even great insights and analytics are of no use if they are not interpreted by decision-makers. This element is about communicating analytics in understandable, compelling form through reports, dashboards, and visual narratives.
Good visualisation makes it easier for complex data without oversimplifying the message. It flags up important trends and relationships, so that patterns are clearly visible to viewers of whatever technical background.
For small businesses, this could translate to building straightforward dashboards that monitor the most important measures of performance (KPIs) or printing up-to-date reports that convert data into action recommendations instead of showing figures.
Implementation and Measurement
The last and most important element is actioning insights. That involves creating actual strategies from your analytics, making changes, and subsequently measuring outcomes to develop a cycle of ongoing improvement.
This process turns analytics from a fascinating activity into a business expansion driver. It’s a matter of developing a feedback process where changes are guided by insights, the changes are quantified, and fresh insights are generated.
For instance, if your data shows customer retention declines after three months, you may institute a new onboarding and follow-up system, then test if this improvement enhances retention rates.
Unlock Business Intelligence with Our Analytics Solutions
Step-by-Step Guide to Building Your Analytics Capability
Want to drive your business with more insightful analytics? Here are some pragmatic steps:
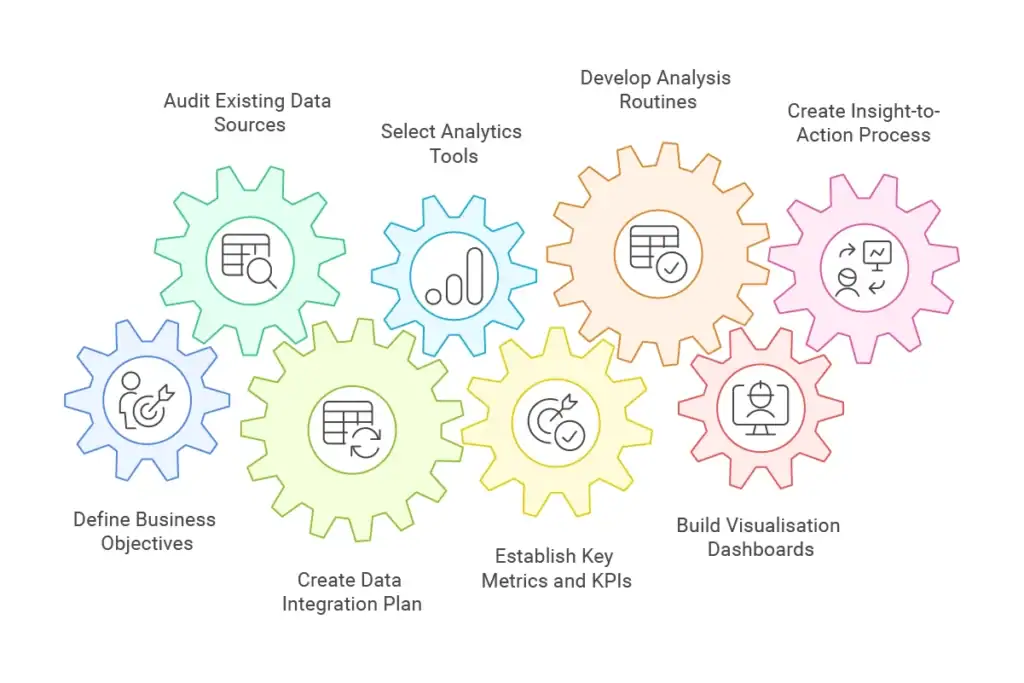
Define clear business objectives
Begin with defining specific questions you want answered or issues that need addressing. Your efforts with analytics should have a direct purpose relating to your business objectives, such as reducing customer churn, enhancing marketing return on investment, or optimizing operations. Being particular will keep your data gathering and analysis in check with what is most important.
Audit your existing data sources
Take inventory of all the data you already gather across your company—from website analytics and CRM history to sales information and customer feedback. Review the quality, accessibility, and completeness of that data. Identify any major gaps where you need to begin gathering new data to address your most important business questions.
Create a simple data integration plan
Implement a simple way of integrating your most essential sources of data. This could be through integration software that links your current platforms, creating scheduled data exports, or adopting a core dashboard solution. The aim is to eliminate redundant work while providing a more comprehensive picture of your business performance.
Select appropriate analytics tools
Select tools that align with your organization's technical capabilities and business requirements. Most user-friendly analytics solutions have robust capabilities without needing data science skills. Begin with easy-to-use options having clear visualisations and guided analysis capabilities before evaluating more sophisticated alternatives.
Establish key metrics and KPIs
Identify the specific metrics that best indicate progress toward your business goals. Limit yourself to 5-8 truly important KPIs rather than tracking dozens of metrics that create noise and confusion. For each KPI, establish baseline measurements, set realistic targets, and determine how frequently you'll review performance.
Develop basic analysis routines
Develop simple, regular processes for looking at your data. This may be a weekly review of site performance, monthly review of customer acquisition costs, or quarterly in-depth examination of customer satisfaction metrics. Regularity brings trending over time and embeds analytics into your business rhythm.
Build visualisation dashboards
Design simple, readable methods of presenting your most critical metrics. Great dashboards present key information at a glance and enable users to drill down into details as necessary. Emphasize designing views that provide a story of your business performance and trigger action when metrics take a bad turn.
Create an insight-to-action process
Develop a systematic process for converting analytics results into business action. This would involve setting up periodic review meetings where members go through implications of the findings, generate possible reactions, and delegate specific tasks with deadlines and responsibility.
Recommended Analytics Tools for Small Businesses
You don’t require enterprise-level budgets to deliver impactful analytics. Some of the following easily accessible tools deliver profound insights without overwhelming complexity:
- Google Analytics 4 provides in-depth website and app analytics that exceed simple traffic measures to monitor the journeys of users and conversion sequences. Its compatibility with other Google products makes it especially useful for companies leveraging Google Ads or YouTube. The basic version is free and has more than enough features for most small businesses.
- Hotjar brings together analytics and user feedback features so you can not only see what users are doing on your website through heatmaps and session recordings but also why they are doing it through surveys and feedback widgets. This marriage of quantitative and qualitative insights aids in building more insightful customer knowledge.
- Tableau Public offers advanced data visualisation in a free version that is well-suited for small businesses. Its drag-and-drop interface is easy to use for non-technical end-users, yet still provides advanced visualisation features that enable effective communication of insights.
When choosing tools, choose solutions that work in conjunction with your current systems and align with your team’s level of technical comfort. Beginning with minimal tools and expanding over time tends to be more successful than adopting high-level systems that never get used.
Common Analytics Mistakes and How to Avoid Them
Even the best-intended analytics initiatives get off track. Here are four pitfalls and how to avoid them:
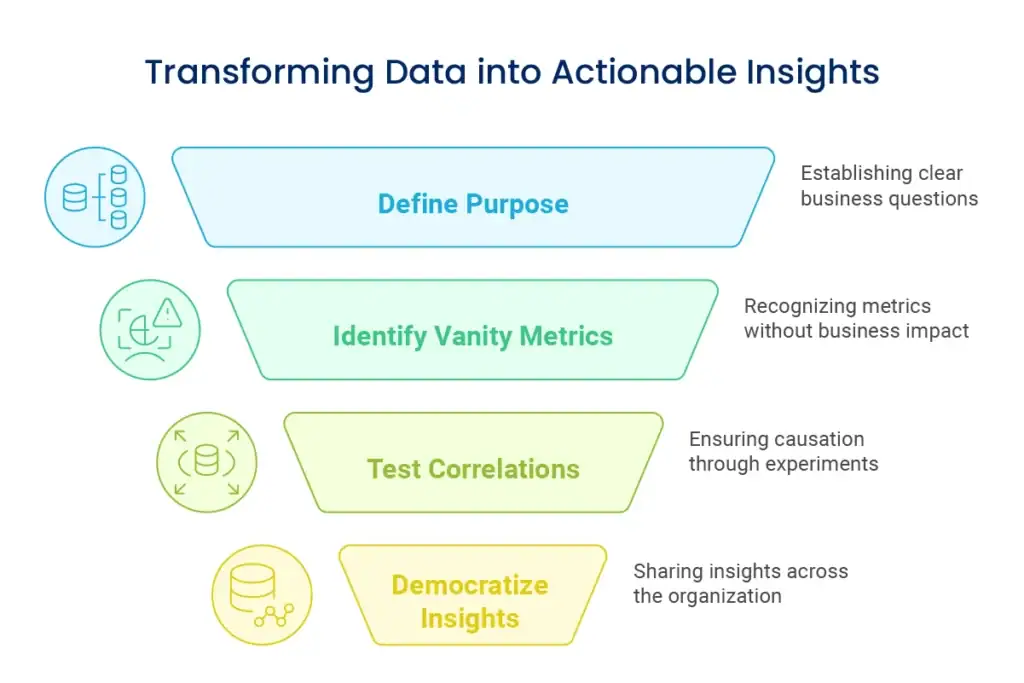
Collecting data without clear purpose
Most companies fall into the trap of accumulating huge amounts of information merely because they can, without linking this data to particular business questions. This results in bloated data lakes producing very few useful insights.
Solution: Don’t add any new tracking or data collection before asking yourself “What particular business decision will this data enable us to make?” If you can’t come up with a good answer, don’t collect that data.
Focusing on vanity metrics
We can all easily get stuck on numbers that appear impressive but have no significant relationship to business results—such as blank page views without conversion context, or social followers without engagement quality.
Solution: For every metric you monitor, ask “If this number significantly changes, would we do anything different?” If not, it could be a vanity metric that’s sucking up attention but not driving action.
Misinterpreting correlation as causation
When two numbers move in tandem, it is too easy to believe one drives the other. This can create a strategy that isn’t targeting the actual drivers of business performance.
Solution: Test relationships between variables using controlled experiments when possible. When you see correlations, generate alternative explanations and seek out further data that would confirm or deny your original interpretation.
Failing to democratise analytics
When insights are stuck with one analyst or department, their value is lost quickly. Individuals closest to customers and operations usually possess the context necessary to take data and turn it into effective action.
Solution: Build easily accessible dashboards and regular summaries of insights that can be understood by team members throughout your organisation. Spend time developing foundational data literacy so the whole team can engage with data-driven conversations.
Moving Beyond Reporting to Genuine Insights
Where simple reporting diverges from genuine analytics is in the leap from “what happened” to “why it matters and what we should do about it.” Here’s how to upscale your approach:
- From Data to Decision-Making
- Customer Behaviour Analysis
- Predictive Analytics for Small Businesses
- Competitive Intelligence Through Analytics
From Data to Decision-Making
Successful analytics and reporting is not simply about creating charts and tables—it’s about establishing a foundation for improved business decisions. This means looking beyond the numbers themselves to their meaning for your strategy and operations.
For instance, rather than simply observing that your email open rates went down 15%, explore further to see which customer segments are impacted most, try varying subject line tactics, and consider whether your content remains relevant to address what your audience needs today.
The most important distinction is shifting from passive observation to active investigation and response. Every report must conclude with suggested actions or questions for greater probing, not only a summary of what the figures indicate.
Customer Behaviour Analysis
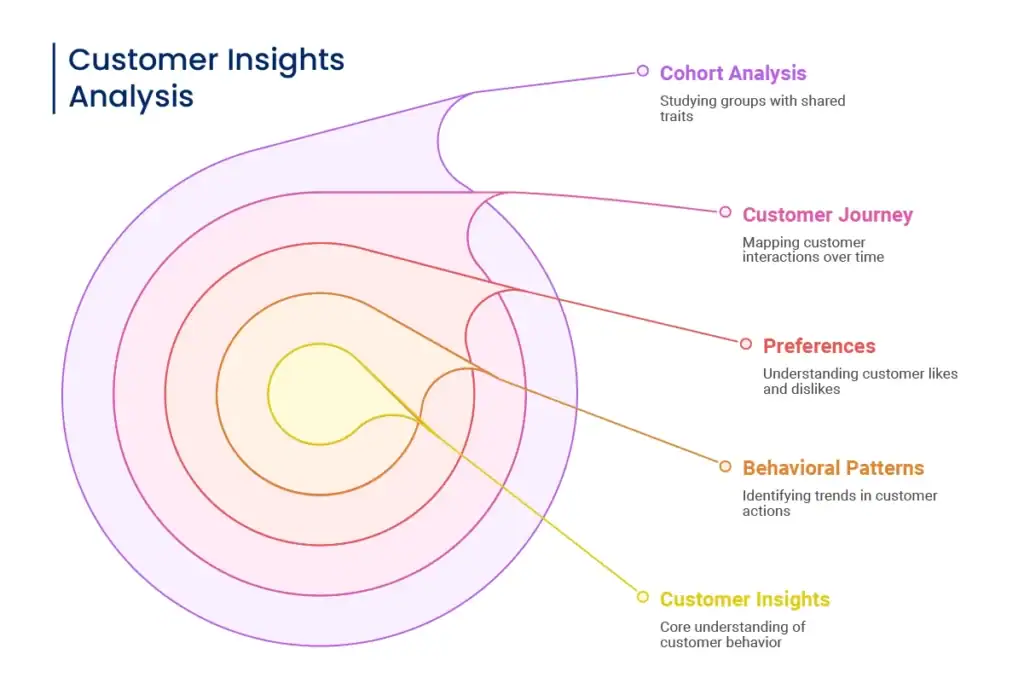
Knowing how your customers experience your brand through touchpoints generates some of the most useful business insights. This surpasses simple demographics to look at behavioural tendencies, likes and dislikes, and the customer journey.
Through the study of customer behavior, you are able to define friction points in your sales process, spot cross-selling or upselling opportunities, and create more targeted content marketing initiatives that meet specific needs of the customers.
More sophisticated methods such as cohort analysis—analyzing groups of customers that have common traits or experiences—can uncover how retention and lifetime value vary by segments and guide you to concentrate resources on your highest-potential customer relationships.
Predictive Analytics for Small Businesses
Though predictive analytics may seem to demand data science talent, even small businesses can put in place simple forecasting methods that are of strategic value. Simple trend analysis and pattern observation can be used to predict seasonal fluctuations, forecast resource requirements, and detect early warning signs of shifting market conditions.
For instance, with a review of past sales history in conjunction with metrics such as spending on marketing, seasonal trends, and competitor activity, you can make more precise sales projections that enhance inventory control and cash planning.
The objective isn’t forecast perfection, but uncertainty reduction to the point that more informed business decisions regarding resource utilization, expansion investments, and risk mitigation can be made.
Competitive Intelligence Through Analytics
Your own metrics report only half the story. Adding competitive intelligence to internal analytics adds vital context for understanding your performance and spotting market opportunities.
This may involve monitoring the online presence of competitors using SEMrush or SimilarWeb, their social media activity and content marketing strategy, or studying the relative positioning comparison using brand perception surveys.
The knowledge obtained assists you in determining your real competitive strengths, identifying market gaps that are areas of growth, and predicting competitive threats before they have a substantial effect on your business.
The Future of Insights and Analytics
Accessible AI and Machine Learning
Artificial intelligence is becoming more affordable for smaller organisations in the form of easy-to-use tools that do not need data science talent. These technologies have the capability to automatically detect patterns in your data, segment customers by behaviour, or forecast outcomes such as churn risk or probability of purchase.
As enterprise-level AI solutions are still pricey, numerous analytics platforms do include machine learning capabilities that make some of these functions accessible to those with more modest budgets. These applications can assist in making non-apparent relationships in your data and speeding up the discovery of insights.
Real-Time Analytics Capabilities
The worth of business insights and analytics tends to lose value rapidly over time. Real-time analytics—which delivers instant feedback on business processes and customer interactions—is increasingly crucial and more easily attainable.
For instance, real-time dashboards will notify you of abnormal patterns of traffic on a website, and you can solve technical problems immediately before they affect sales drastically. Likewise, real-time feedback on the performance of a campaign enables you to tweak messaging or targeting while an offer is ongoing, instead of having to wait to analyze results once it’s ended.
Data Privacy and Ethics Considerations
With increasing analytics sophistication come worries regarding data privacy and responsible use of customer data. Progressive companies are going beyond regulatory compliance with laws such as GDPR to leverage privacy as a brand differentiator.
This involves instituting transparent data practices, providing customers with control over their data, and taking thoughtful consideration of the ethical impact of the way you employ analytics to drive customer behavior. Establishing trust through responsible data practices lays a basis for customer relationships that are sustainable in an increasingly privacy-sensitive market environment.
Turn Data Into Actionable Insights – Get Started
Conclusion
Smart insights and analytics is not about collecting the greatest volume of data or most advanced tools—it’s about getting the right questions asked, identifying valuable patterns, and making timely action with what you know. For small and medium-sized enterprises, this strategic use of analytics can deliver big competitive gains with limited resources.
The companies that succeed in today’s information-plentiful world aren’t always those with the largest datasets, but those that best interpret information into action. Through building a useful analytics capability targeted at your most consequential business questions, you build a decision-making lead that grows over time.
Keep in mind that analytics is a path, not an end. Begin with the fundamentals, emphasize questions of greatest importance to your business growth, and build your skills gradually as you observe results. Each decision based on insight builds upon another, forming a growing more potent competitive advantage through more intelligent, better-informed strategy.
Need Help with SEO Content Strategy?
If you want to make your business decision-making stronger through improved insights and analytics, professional advice can assist you in establishing the proper foundation and preventing costly missteps. Our strategic brand management solutions encompass analytics strategy development, bespoke dashboard development, and training for extracting maximum value from your business data.